Import and export records are most useful in market research when they answer a defined commercial question: which markets merit deeper study, which companies appear active in a product category, or how a trade route has changed over time. A record is evidence of a reported movement under a particular national statistical or customs system; it is not, by itself, a complete picture of demand, company quality, or future sales.
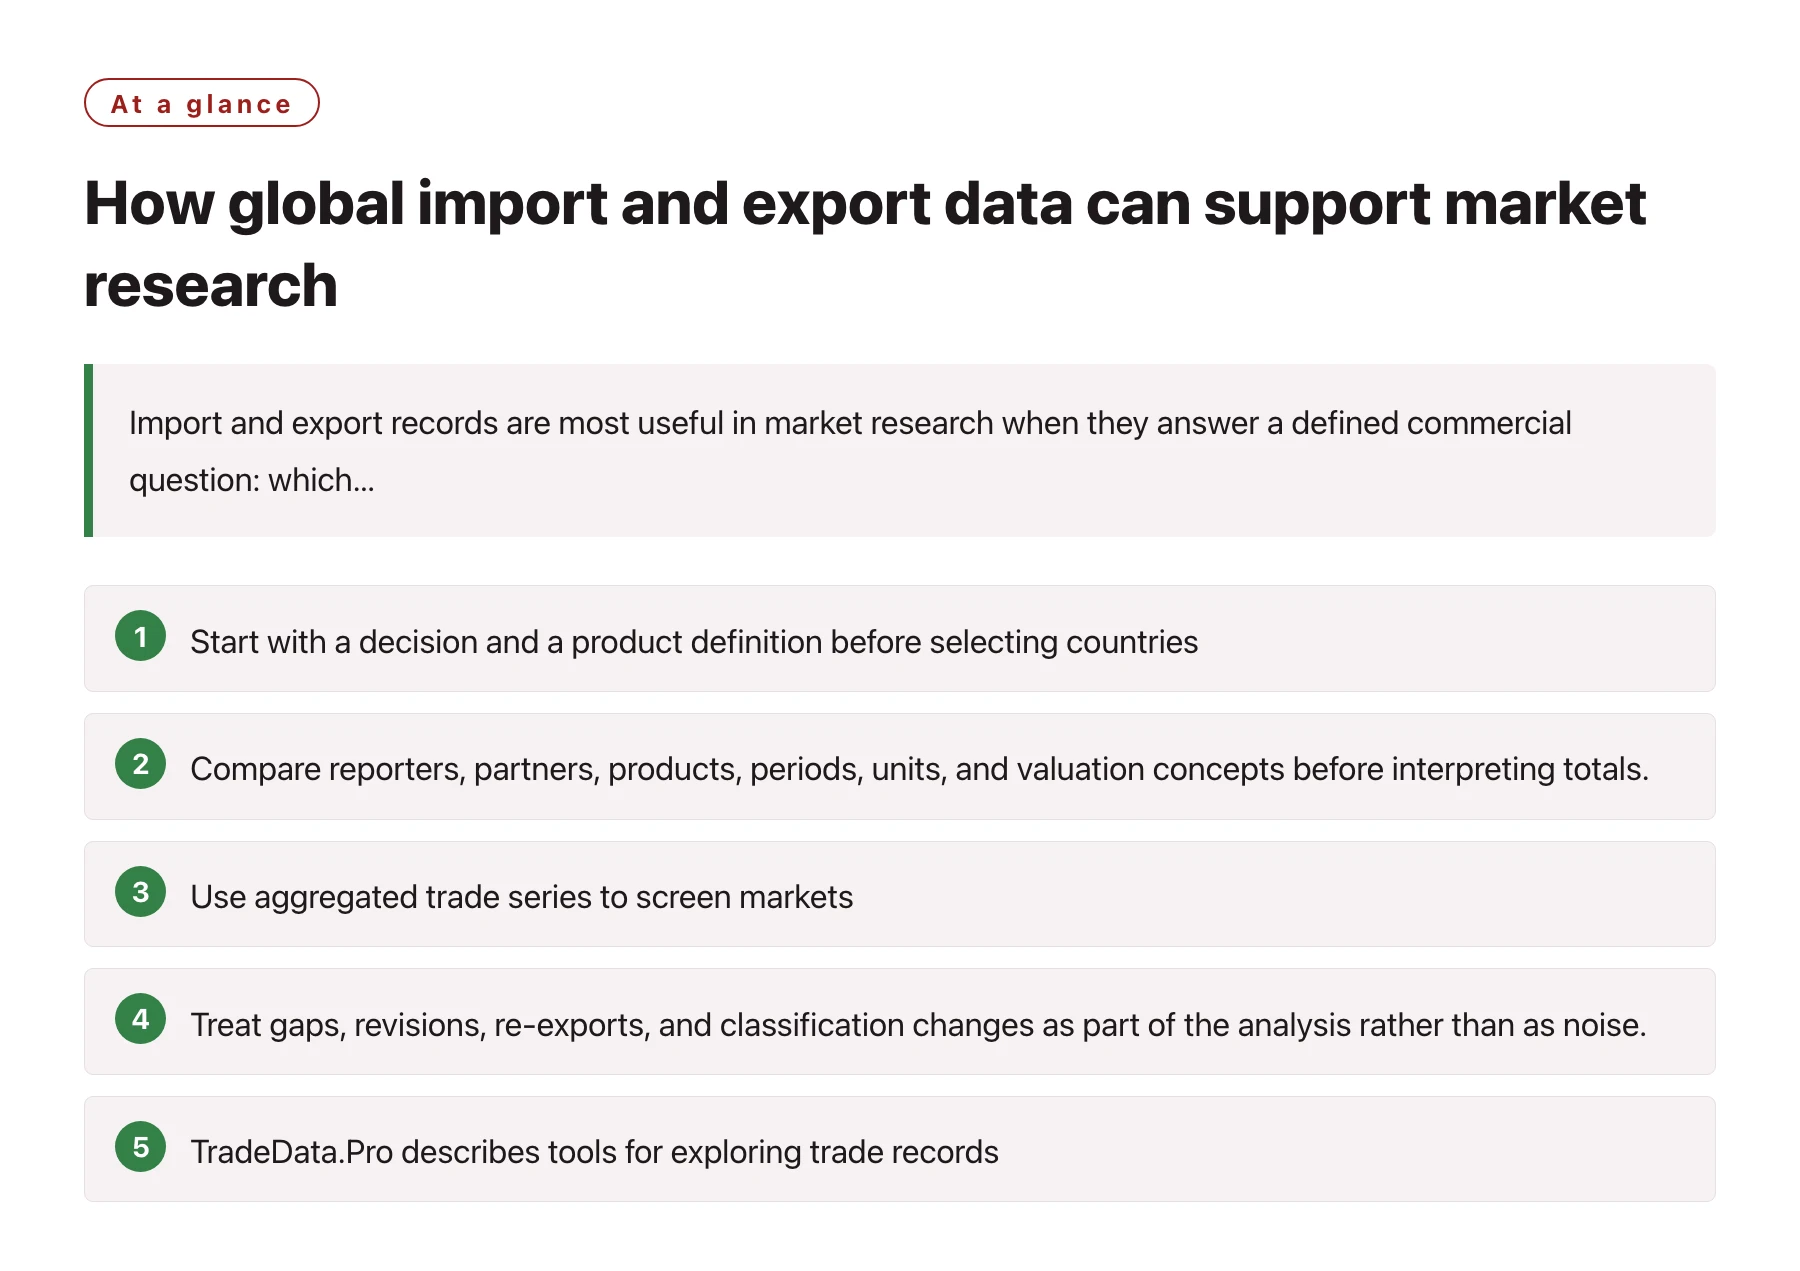
Key takeawaysStart with a decision and a product definition before selecting countries, periods, or data fields. · Compare reporters, partners, products, periods, units, and valuation concepts before interpreting totals. [1] · Use aggregated trade series to screen markets, then investigate company or shipment-level evidence where lawfully available. · Treat gaps, revisions, re-exports, and classification changes as part of the analysis rather than as noise. · TradeData.Pro describes tools for exploring trade records, filtering by product and geography, and researching companies; verify that the available coverage fits the question.
Market research often begins with a broad list of countries or product categories. Trade statistics can make that list more evidence-based by showing recorded flows between reporting economies and their partners. The benefit is not that a database makes the decision automatically. The benefit is that it gives an analyst a repeatable starting point for asking better questions.
A disciplined workflow separates three jobs: screening a market, understanding the structure of trade, and validating a potential commercial relationship. Different data sources and levels of detail suit each job, and none should be mistaken for the others.
1. Define the decision before searching
Write the decision in one sentence. For example: “Which three destination markets should receive a closer review for this product family?” is more useful than “Find interesting trade data.” Then specify the product scope, the buyer or supplier perspective, the geography, and the time window. If the product has several common names, technical variants, or tariff classifications, record those alternatives before searching.
This step prevents a common research error: changing the query until a chart looks persuasive. A market screen should be designed before the result is visible. Decide what evidence would move a market onto the next-stage list, what evidence would keep it there, and what missing information would make the result inconclusive. For a new export market, the screen might include import flows for a carefully defined product group, evidence of multiple suppliers, and a separate check of duties, regulations, and customer access.
Also define the unit of analysis. A country total, a product code, a company profile, and a shipment record answer different questions. If the first question is market size, start with an aggregate series. If the question is whether a named company has appeared in trade activity, company-oriented records may be relevant, subject to the source’s coverage and legal terms.
2. Make the product and geography comparable
A product label in a sales catalogue rarely maps perfectly to a statistical classification. Search using the plain-language product name, technical synonyms, materials, and likely classification terms. Keep a mapping table that records the chosen code, its description, the classification revision, and any nearby codes that could include substitutes or components. Do not silently add adjacent categories simply to create a larger market total.
The Harmonized System provides an international nomenclature used to classify traded goods, while national tariff schedules can extend the code to more detailed levels. A six-digit comparison may be more suitable across economies than a national suffix, but even a shared code does not guarantee identical commercial scope. Confirm the schedule and effective period relevant to the country and year under review.
Geography also needs a precise definition. The reporter is the economy that records the flow; the partner is the trading counterpart represented in that record. “Imports from country X” and “exports reported by country X” may not match exactly. Statistical practices, timing, coverage, valuation, and re-exports can all affect the two sides of a bilateral comparison. The WTO technical notes explain that general and special trade systems differ in how certain warehouse and re-export flows are treated. [1]
3. Use aggregate series to screen, not to certify demand
Once the product and geography are stable, examine several periods rather than a single annual total. A multi-year view can reveal whether a value is persistent, volatile, seasonal, or affected by a reporting break. Where the dataset offers both quantity and value, inspect both. A rising value with flat quantity may reflect price or product-mix changes; a change in value alone does not prove that underlying demand has grown.
Check metadata before comparing countries. Confirm whether the figures cover general or special trade, how the reporting authority treats free zones, what currency and valuation basis apply, and whether the product classification changed. International merchandise statistics are commonly compiled from customs records about physical movements; national accounts and balance-of-payments measures can use different concepts. The WTO notes describe differences in coverage, trade systems, and valuation that can prevent two otherwise plausible totals from being directly interchangeable. [1]
For a U.S.-focused question, the Census Bureau’s international trade resources expose totals and breakdowns by classification and geography, as well as an API and historical data products. Those resources illustrate why a researcher should choose the appropriate table and time series rather than relying on a headline total. Other economies publish their own official sources and metadata, so a global comparison should document where each observation came from and when it was retrieved. [2]
4. Move from a market screen to company research
An aggregate series can identify where to investigate, but it cannot establish that a specific importer is a good prospect. After a market passes the first screen, create a second-stage research plan: identify relevant importers or distributors, distinguish recurring activity from isolated records, compare product descriptions, and check whether the company’s business model fits the offer. A company’s public website, filings, certifications, and direct conversations may be needed to test the commercial interpretation.
If shipment-level records are available, read each field as a reported data point rather than as a verified sales lead. Names may be abbreviated, translated, normalized, or shared by unrelated entities. Product descriptions may be broad. A shipment indicates movement recorded in the source; it does not confirm present purchasing intent, financial health, a procurement contact, or willingness to switch suppliers. Maintain a confidence note for each inference and seek independent corroboration before outreach.
A platform such as shipment data can be considered when the research requires searchable records and company-level exploration across markets. Before relying on any platform, check the countries, time periods, fields, update cadence, sample records, and permitted use that apply to the subscription or demonstration. The point of the tool is to make a research workflow easier to execute, not to replace source evaluation.
5. Keep a transparent research trail
A useful market-research memo lets another analyst reproduce the logic. Save the query date, selected reporters and partners, product definitions, code revisions, date range, units, filters, and any transformations. Keep original values alongside calculations. If a chart is indexed or seasonally adjusted, label the operation and its base. If records were deduplicated or company names normalized, document the rule and preserve the raw identifiers for audit.
Separate observations from interpretations. “Reported imports rose in the selected series” is an observation. “The market is attractive” is an interpretation that needs additional support, such as addressable customer segments, duties, route economics, competition, regulatory conditions, and a realistic entry plan. A short limitations section should mention non-reporting, revisions, breaks in continuity, inconsistent partner reporting, or uncertainty in product matching when they matter to the decision.
Finally, use a stop rule. If two data sources disagree, do not average them by default. Compare definitions and coverage first; then explain which source is fit for the question. If the discrepancy cannot be resolved, report a range or mark the result inconclusive. This is more valuable to decision-makers than a single precise-looking number with hidden assumptions.
Sources
Frequently asked questions
Can import and export data prove that a market has unmet demand?
No. Trade flows can help screen activity and identify questions for further research, but they do not directly measure unmet demand, willingness to buy, or future sales.
Why can reported imports and partner-reported exports differ?
Countries may use different timing, coverage, valuation, trade-system, classification, and revision practices. Re-exports and reporting gaps can also affect bilateral comparisons.
Should a market screen use a single year of trade data?
Usually it is safer to inspect multiple periods and metadata. A single year can be unusual, revised later, or affected by a classification or reporting change.
What should be checked before using shipment records for prospect research?
Confirm coverage and permitted use, review how names and product descriptions are represented, and independently verify company identity and current commercial fit.